FAQ Scatterplots
I want to inspect my classifier in a scatter plot, but it doesn’t work
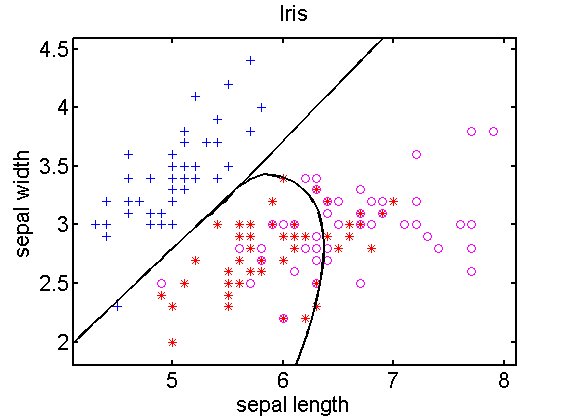
A scatterplot shows a 2-dimensional vector space. The scatterplot istself, created by scatterd, uses just two features. Even if it is called for a larger dataset, just the first two features are used. The data points shown in the scatter can be interpreted as projections from the full feature space to the 2-dimensional space used in the scatterplot.
a = iris; % load 4D dataset from prdatasets
scatterd(a); % shows a scatterplot for the first two features
In case a classifier W has been computed for the Iris dataset, it is defined in a 4-dimensional space. This cannot be shown in a 2-dimensional projection. This doesn’t make sense. As this caused many problems with starting students, an error message is displayed in the most recent versions of PRTools if one attempts to plot such a classifier:
w = a*qdc;
 plotc(w);

??? Error using ==> plotc at 110
Plotc can only plot classifiers operating in 2D.
Consequently, it is not possible to inspect multi-dimensional classifiers for more than two dimensions. scatterd and plotc just give an impression in 2D. What is really happening might be entirely different.
w2 = a(:,1:2)*qdc;
plotc(w2);

