featsel_ex2
Examples of various feature selection procedures, organised per classifier
PRTools and PRDataSets should be in the path
Download the m-file from here. See http://37steps.com/prtools for more.
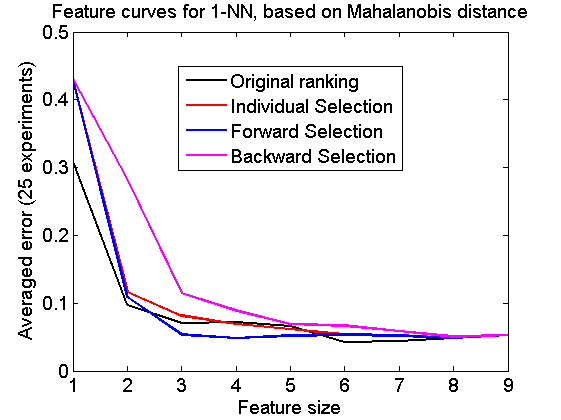
Feature curves are shown for 6 feature rankings computed by 3 procedures:
- Individual selection
- Forward selection
- Backward selecton
and 2 criteria:
- The Mahalanobis distance
- The leave-one-out nearest neighbor performance
These criteria are computed for the entire training set. Each of the 6 plots shows the performance of one of three classifiers for 3 ranking procedures in a comparison with the original ranking. Classifier performances are based on a 50-50 random split of the dataset for training and testing. The three classifiers are:
- 1-NN rule
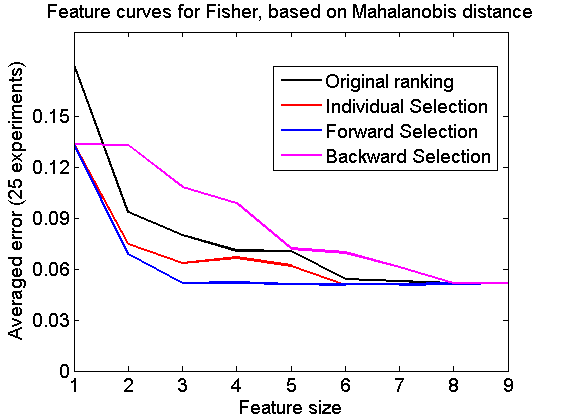
- The Fisher classifier
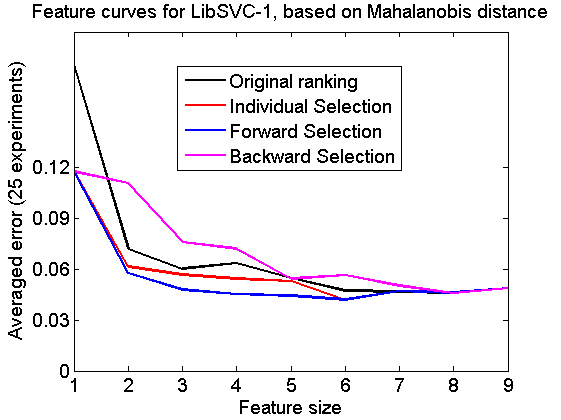
- The linear support vector machine.
In another, very similar example, featsel_ex1 the same curves are organised per ranking procedure instead of per classifier.
Contents
Show dataset
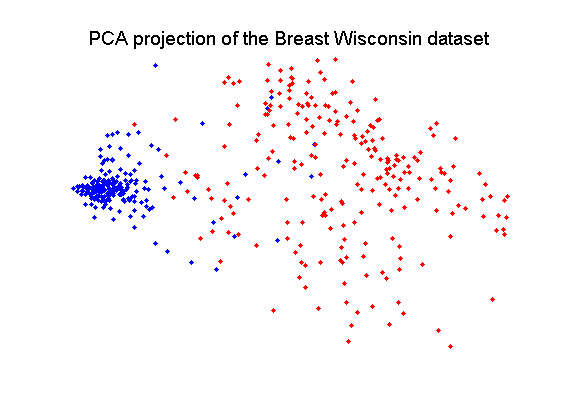
The Breast Wisconsin dataset is based on 9 features and 683 objects in two classes of 444 and 239 objects.
delfigs
a = breast;
a = setprior(a,0);
scattern(a*pcam(a,2));
title(['PCA projection of the ' getname(a) ' dataset'])
fontsize(14);
Define classifiers
w1 = setname(knnc([],1),'1-NN');
w2 = setname(fisherc,'Fisher');
w3 = setname(libsvc,'LibSVC-1');
w = {w1,w2,w3};
nreps = 25;
Define feature selectors using Mahalanobis distance
define unit mapping
v0 = setname(prmapping,'Original ranking');
% individual selection
v1 = setname(featseli(a,'maha-s',size(a,2)),'Individual Selection');
% forward selection
v2 = setname(featself(a,'maha-s',size(a,2)),'Forward Selection');
% backward selection
[v3,r] = featselb(a,'maha-s',1);
v3 = setname(featsel(size(a,2),[+v3 abs(r(2:end,3))']),'Backward Selection');
v = {v0,v1,v2,v3};
Compute feature curves per classifier ranked for Mahalanobis distance
for j=1:numel(w)
  e = cell(1,numel(v));
  for i=1:numel(v)
    randreset; e{i} = clevalf(a*v{i},w{j},[],0.5,nreps);
    e{i}.names = getname(v{i});
  end
  figure; plote(e)
  title(['Feature curves for ' getname(w{j}) ', based on Mahalanobis distance']);
  set(gca,'xticklabel',1:size(a,2)); set(gca,'xtick',1:size(a,2));
  fontsize(14);
end
Define feature selectors using NN performance
define unit mapping
v0 = setname(prmapping,'Original ranking');
% individual selection
v1 = setname(featseli(a,'NN',size(a,2)),'Individual Selection');
% forward selection
v2 = setname(featself(a,'NN',size(a,2)),'Forward Selection');
% backward selection
[v3,r] = featselb(a,'NN',1);
v3 = setname(featsel(size(a,2),[+v3 abs(r(2:end,3))']),'Backward Selection');
v = {v0,v1,v2,v3};
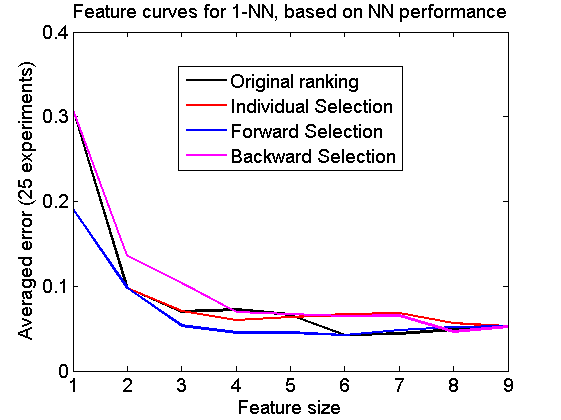
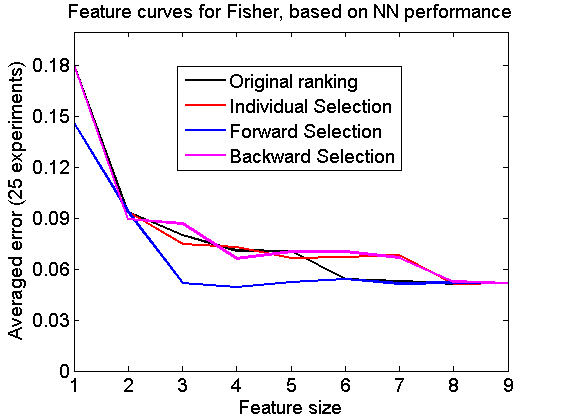
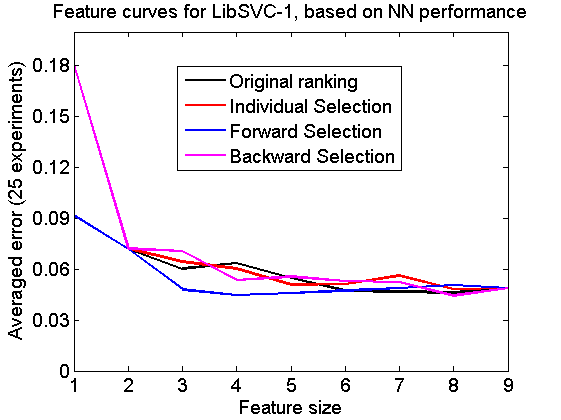
Compute feature curves per classifier ranked for NN performance
for j=1:numel(w)
  e = cell(1,numel(v));
  for i=1:numel(v)
    randreset; e{i} = clevalf(a*v{i},w{j},[],0.5,nreps);
    e{i}.names = getname(v{i});
  end
  figure; plote(e)
  title(['Feature curves for ' getname(w{j}) ', based on NN performance']);
  set(gca,'xticklabel',1:size(a,2)); set(gca,'xtick',1:size(a,2));
  fontsize(14);
end